One thing that I don't like about Discogs is that the images in the database are not tagged with metadata about the contents. It would be a lot easier if I would know if an image is a label, or a sleeve, or something else. I actually
talked about this before, but so far my suggestion hasn't been picked up yet.
One of the reasons for it is that it would help my quest for
finding promising candidates for fixing releases and I don't have to actually click on a release to then find out that there is no label image. It is a really repetitive process, so I wanted to see how easy it is to automatically identify that an image contains a label.
The quality of the images in Discogs varies a lot, but typically good quality images are (at least) 600x600. At least a few years ago images were automatically scaled which confused people, as they uploaded what they thought were "better images" only to seem them scaled to the same dimensions!
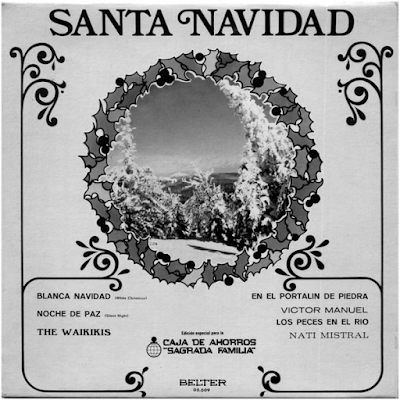
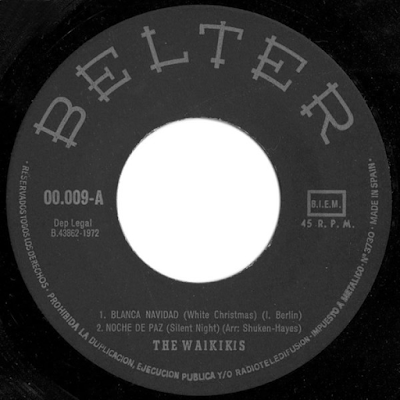
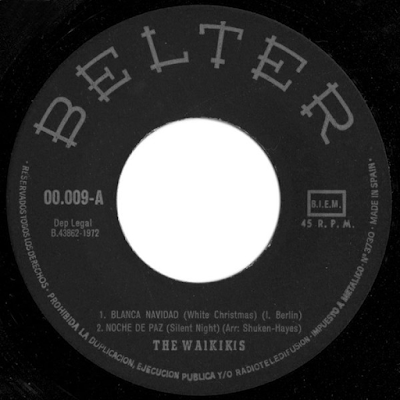
I picked a release from Discogs, in this case
a release from Spain, with high quality scans that have been properly cropped. It should be noted that this is the gold standard. Unfortunately reality for most releases is very different, as you will see images that are not properly cropped, have only part of the label, are out of focus, have glare (the camera flashed, or the reflection of a lamp), have pictures of other records on them as well, or hands of people holding the record, or parts of living rooms or shops, and so on.
Looking at the images I wondered which approaches I could take to find out whether or not a picture contains a label. The first approach I took is to look at parts of the image and then analyze the colours using histograms.
The reason I think that works: colour wise labels are usually not the most exciting part of the record, as the artwork tends to be on the sleeve, not on the label, because that is inside the sleeve and people browsing through records in a record store would not see the label, just the sleeve.
There are of course exceptions and some bands had their own labels made as soon as they were big enough (example: Queen had singles with
a label of their own design) but mostly it was the standard label for all releases, produced in bulk. This means that labels typically have few colours. In the example the picture has a standard blue label, with grey text.
Histograms
One approach is to look at a histogram of an entire image. Enter Python and OpenCV! I had a copy of
Practical Python and OpenCV that I bought as part of a Kickstarter campaign, and it seemed like the right tool.
So I computed the histograms of the front sleeve and the label. For that I first split the image in its RGB components, which looks like this for the front sleeve:
 |
| Blue component of front sleeve |
 |
| Green component of front sleeve |
 |
| Red component of front sleeve |
As you can see there is a lot of red, quite a bit of green and almost no blue. The histogram for the three colours looks like this:
 |
| Histogram for blue component (sleeve) |
 |
| Histogram for green component (sleeve) |
 |
| Histogram for red component (sleeve) |
And then the same for the label:
 |
| Blue component of label |
 |
| Green component of the image |
 |
| Red component of the image |
As you can see there is very little red, very little green and quite a bit of blue, and a big white circle in the middle.
The histograms (using 1 bucket per colour, so 256 buckets in total) look like this:
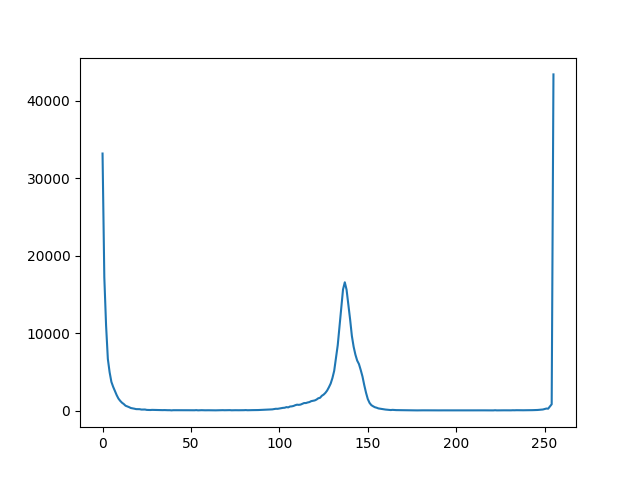 |
| Histogram for blue component (label) |
 |
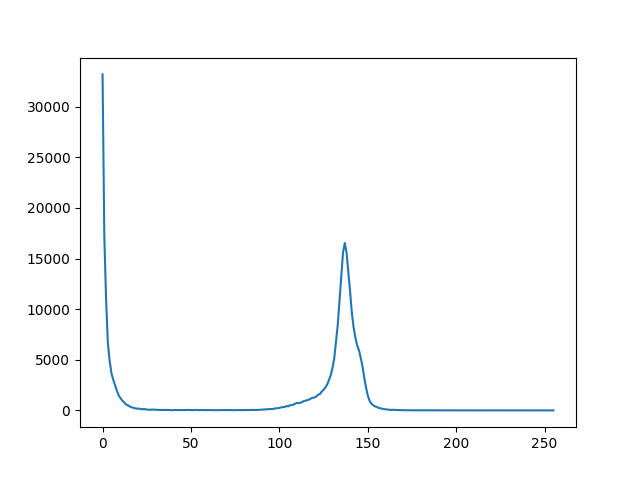
| Histogram for green part (label) |
 |
| Histogram for red part (label) |
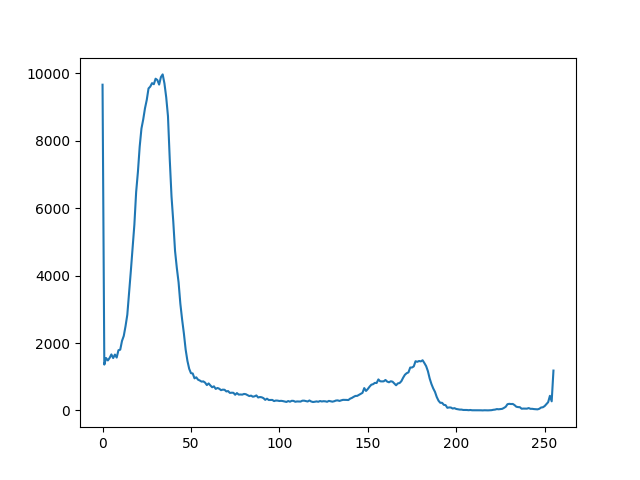
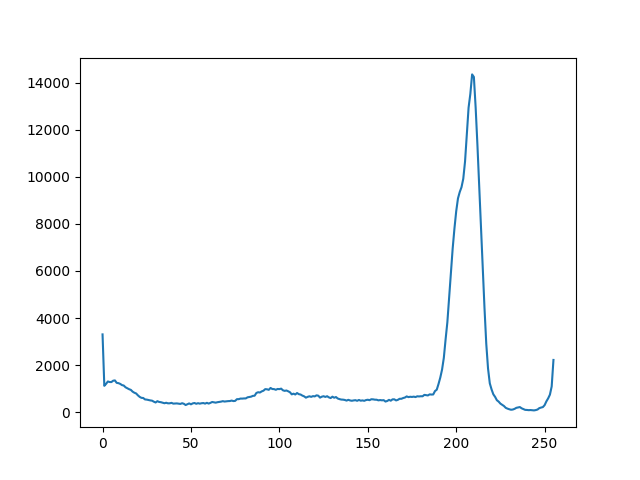
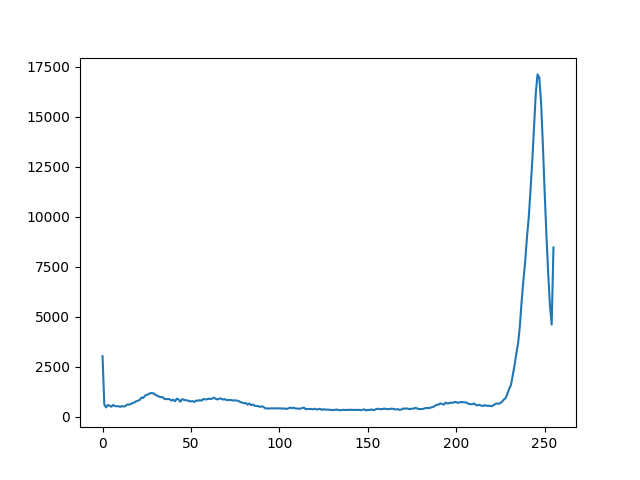
A few things stand out: first of all there is a big peak at the right of each histogram: these are the white pixels in the middle (for the colour white each component will be set to 255, or near 255) which are distorting the results. When ignoring the white in the middle the histograms look like this:
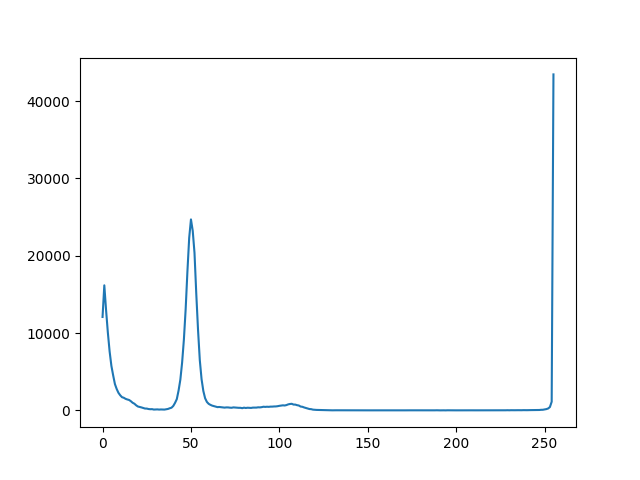
 |
| Histogram for blue part (label), hole masked |
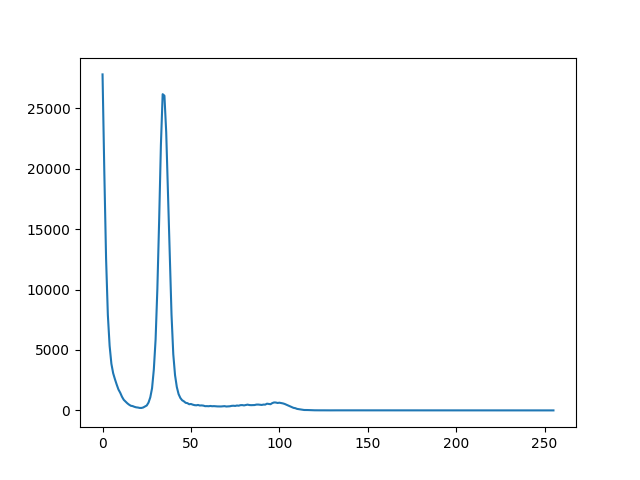
 |
| Histogram for green part (label), hole masked |
 |
| Histogram for red part (label), hole masked |
For each of the colours there is also a bump near 100: these are the pixels for the text on the label (you can verify the RGB values with a colour picker). The peaks at the left (for black) are not that high for the green component. This is because not all of the black pixels are truly black: probably some light reflected during the scanning process. For pictures made with regular photo cameras this is even more so: sometimes I can even see parts of the person who took the picture reflected in the vinyl!
What is also noticeable for the label histogram is that compared to the sleeve histogram the peaks are much clearer, meaning just a few colours were used (as expected).
Regarding the center hole: it is very well possible that for other releases the center hole will not be white, because no scanner was used. Very often I see wood (because it is on a table), or part of a record sleeve, jeans, carpet, and so on.
This is a promising start. The next blog post will dive deeper into histograms.


Comments
Post a Comment